概要
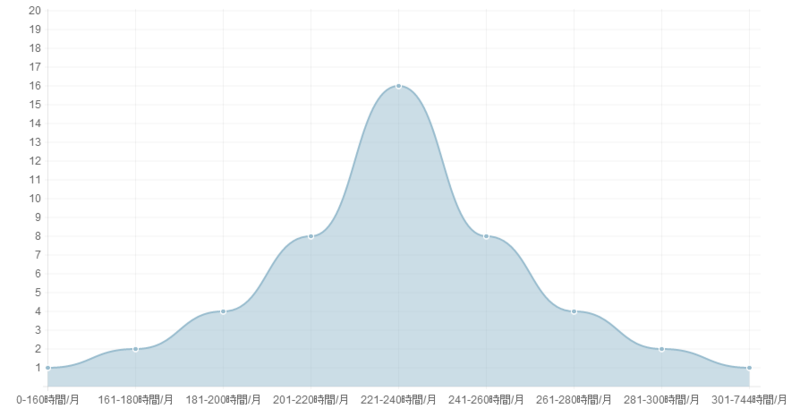
chart.jsでLine Chartを表示する
詳細
chart.jsでLine Chartを表示する
サンプル
<!doctype html>
<html lang="ja">
<head>
  <meta charset="UTF-8">
  <title>Document</title>
  <script src="Chart.min.js"></script>
  <script language="JavaScript"><!--

  function displayLineChart() {
    var data = {
      labels : ['0-160時間/月', '161-180時間/月', '181-200時間/月', '201-220時間/月', '221-240時間/月', '241-260時間/月', '261-280時間/月', '281-300時間/月', '301-744時間/月'],
      datasets : [
        {
          fillColor : "rgba(151,187,205,0.5)",
          strokeColor : "rgba(151,187,205,1)",
          pointColor : "rgba(151,187,205,1)",
          pointStrokeColor : "#fff",
          data : [1,2,4,8,16,8,4,2,1]
        }
      ]
    }

    options = {
      //Boolean - If we show the scale above the chart data
      scaleOverlay : false,

        //Boolean - If we want to override with a hard coded scale
      scaleOverride : true,
      //** Required if scaleOverride is true **
      //Number - The number of steps in a hard coded scale
      scaleSteps : 20,
      //Number - The value jump in the hard coded scale
      scaleStepWidth : 1,
      //Number - The scale starting value
      scaleStartValue : 0,

      //String - Colour of the scale line
      scaleLineColor : "rgba(0,0,0,.1)",

      //Number - Pixel width of the scale line
      scaleLineWidth : 1,

      //Boolean - Whether to show labels on the scale
      scaleShowLabels : true,

      //Interpolated JS string - can access value
      scaleLabel : "<%=value%>",

      //String - Scale label font declaration for the scale label
      scaleFontFamily : "'Arial'",

      //Number - Scale label font size in pixels
      scaleFontSize : 12,

      //String - Scale label font weight style
      scaleFontStyle : "normal",

      //String - Scale label font colour
      scaleFontColor : "#666",

      ///Boolean - Whether grid lines are shown across the chart
      scaleShowGridLines : true,

      //String - Colour of the grid lines
      scaleGridLineColor : "rgba(0,0,0,.05)",

      //Number - Width of the grid lines
      scaleGridLineWidth : 1,

      //Boolean - Whether the line is curved between points
      bezierCurve : true,

      //Boolean - Whether to show a dot for each point
      pointDot : true,

      //Number - Radius of each point dot in pixels
      pointDotRadius : 3,

      //Number - Pixel width of point dot stroke
      pointDotStrokeWidth : 1,

      //Boolean - Whether to show a stroke for datasets
      datasetStroke : true,

      //Number - Pixel width of dataset stroke
      datasetStrokeWidth : 2,

      //Boolean - Whether to fill the dataset with a colour
      datasetFill : true,

      //Boolean - Whether to animate the chart
      animation : true,

      //Number - Number of animation steps
      animationSteps : 60,

      //String - Animation easing effect
      animationEasing : "easeOutQuart",

      //Function - Fires when the animation is complete
      onAnimationComplete : null
    }
    new Chart(document.getElementById("line").getContext("2d")).Line(data, options);
  }
  --></script>
</head>
<body onload="displayLineChart();">
  <div class="box">
    <canvas id="line" height="450" width="900"></canvas>
  </div>
</body>
</html>
