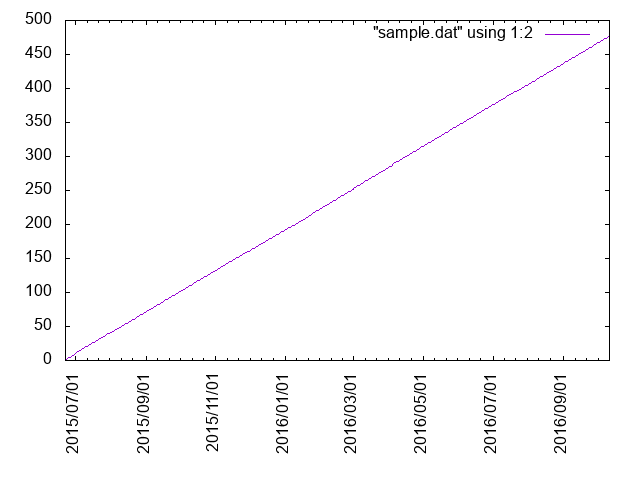
gitでコミット日ごとの総ファイル数を取得してgnuplotでグラフ化してみます。
きっかけは結城先生のツイートです。
(何も調べずに書いてます)
— 結城浩 (@hyuki) 2016年10月11日
gitのリポジトリへのコミット具合をサマライズしてくれるツールで手軽なのあるかな。何をしたいかというと、今回一冊の本書いたgitのリポジトリを概観するツールはあるかな、と。Visualに見せてくれるといいけど、それにこだわらず…
俯瞰と書いてみたものの、自分がどういう情報を欲しいかもよくわかってないんですよね。何となく半年のファイル増減の様子を時系列で見たいというくらいの気持ち。
— 結城浩 (@hyuki) 2016年10月11日
日付とファイル数の組み合わせを抽出する
gitの配管コマンドである git ls-files を利用して抽出します。
配管コマンドに関しては下記記事を参照。
Code
Ruby から git のコマンドを呼び出します。
(私がRubyに慣れているだけで、その他にRubyで作っている理由はありません)
- sample.rb
require 'open3'

base = 'path/to/your/repo'

Dir.chdir(base) do |dir|
  begin
    commits = Open3.capture2('git log --date=short --format="%H,%cd"').first
    ret = commits.each_line.to_a.reverse.each_with_object({}) do |line, memo|
      sha1_date = line.split(',')
      sha1 = sha1_date.first
      date = sha1_date.last.chomp.tr('-', '/')
      Open3.capture2("git checkout #{sha1} >& /dev/null")
      file_count = Open3.capture2('git ls-files | wc -l').first.strip
      memo[date] = file_count
    end
    print ret.map{|e|e.join(',')}.join("\n"), "\n"
  ensure
    system('git checkout master >& /dev/null')
  end
end
処理内容としては
- git log でSHA1とコミット日(年月日)を取得します
- 古いコミットから順に処理します
- 対象コミットをcheckoutして、
git ls-filesコマンドによってその時点のファイル数を取得します - コミット日に対応するファイル数をHashに追加します
- 全てのコミットを収集し終わったら標準出力します
- 最後に後片付けとして master を checkout します
これで、分析対象となる日付とその日のファイル数からなるCSVを抽出できました。 ちなみに、同じ日に複数回のコミットがあった場合は一番最後の時点のファイル数が出力されます。
実行
$ ruby sample.rb > sample.dat
グラフ化する
gnuplot を使ってグラフ化します
データ
先程のRubyスクリプトでgitの履歴から抽出したデータを sample.dat として保存します
- sample.dat
2015/06/23,1
2015/06/24,2
# 中略
2016/10/11,477
2016/10/12,478
ちなみにこのデータは
から抽出しています。
私は2015/06/23からほぼ1日1ファイルずつこのリポジトリにコミットしています。
(たまに忘れてるけど、概ね毎日)
plot
- sample.plot
set terminal png
set output "sample.png"
set datafile separator ","

set xdata time
set timefmt "%Y/%m/%d"
set xrange ["2015/06/23":"2016/10/11"]
set format x "%Y/%m/%d"
set timefmt "%Y/%m/%d"
set xtics rotate

plot "sample.dat" using 1:2 with lines linewidth 1
実行
$ gnuplot sample.plot
結果
